Using data collected since 2005, the Fancy Color Research Foundation unveiled the Fancy Color Diamond Index™ (FCDI) in 2014.
Part 1: Benefits of the Index
The two main target demographics for the FCDI are (i) high-end jewelry retailers and (ii) the financial community. Retailers have long been vying for a practical and credible tool to reflect the price trends of fancy color diamonds as a means to educate their consumers, store staff and buyers. The FCDI allows them to confidently stock and market fancy color diamonds. The financial community has been struggling to engage in this investment class as no credible asset price data was made available by the industry, and the FCDI allows investors, private and institutional, to create asset portfolios, and plan and track return on capital.
In addition to these main target demographics, the FCDI is used by:
- Diamond wholesalers / traders to accurately evaluate inventory and to build confidence with clients and miners
- Diamond manufacturers to improve the rough diamond planning / marking process
- Diamond miners to compare price patterns of fancy color diamond rough product
- Insurance companies to create more accurate valuation for replacement of lost FCDs and policy underwriting purposes
- Consumers / collectors to track the approximate value of their diamonds over time
Part 2: Description of the Different Indexes
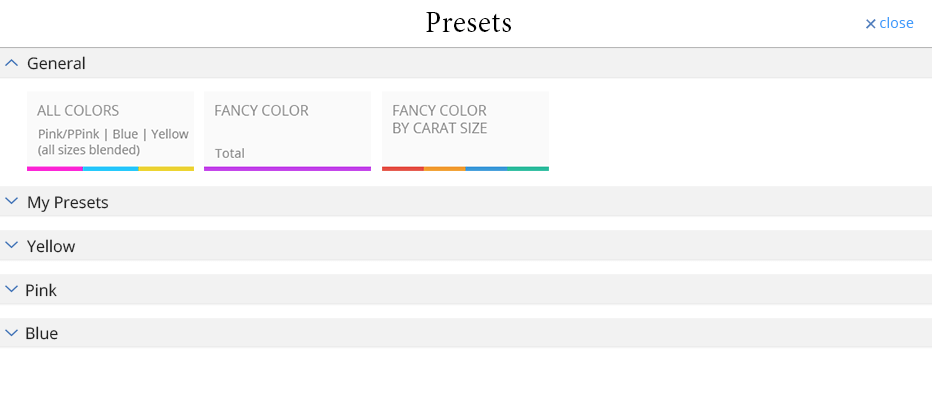
The FCDI compares specific subcategories such as color, size and intensity, and data is arranged in 63 preset graphs. The top of each preset is labeled with a description of the data: i.e., ‘5ct Yellow, by saturation’, ‘Fancy Intense Blue by size’, and so forth. Subscribers have the flexibility to customize their own graphs by clicking the ‘Customize’ button and filling in the fields for carat weight, intensity and color – compare up to three different diamond graphs at a time of any combination of size, color and saturation.
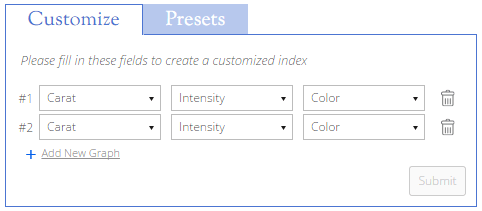
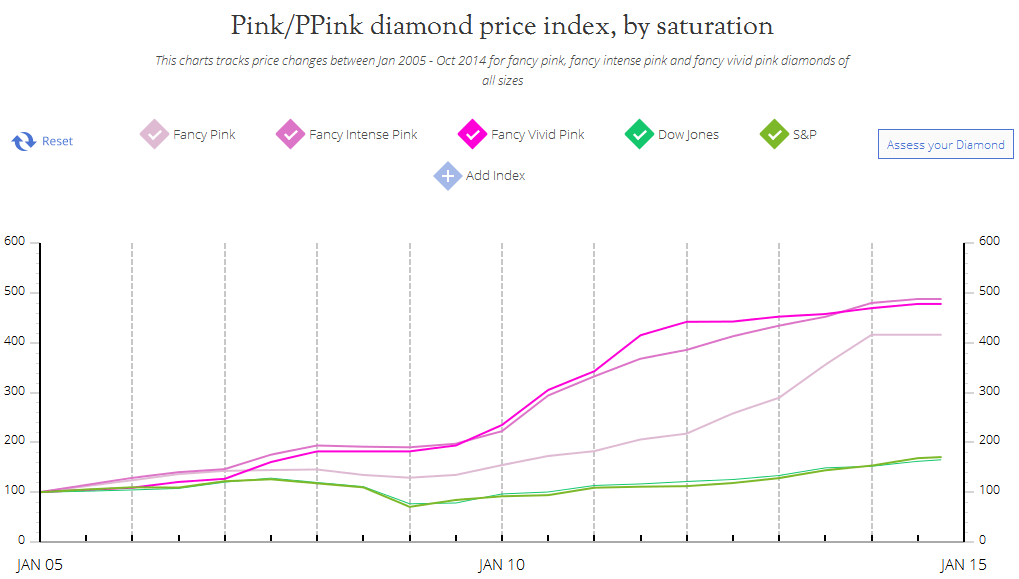
Track the value of a specific stone over time by clicking ‘Assess your Diamond’ and filling in the fields for carat weight, intensity, color and purchase date.

There is also an option to add benchmark indexes such as Dow Jones, S&P or Gold to measure the FCDI performance against other asset classes.
Part 3: A Useful Tip for Navigating the Indexes
Subscribers can click on ‘My Presets’ for easier access to their most frequently used / saved preset graphs and can view indexes specifically by color. Each index assesses a diamond’s wholesale price appreciation by color, saturation level or size. We recommend that subscribers familiarize themselves with all 63 preset graphs.